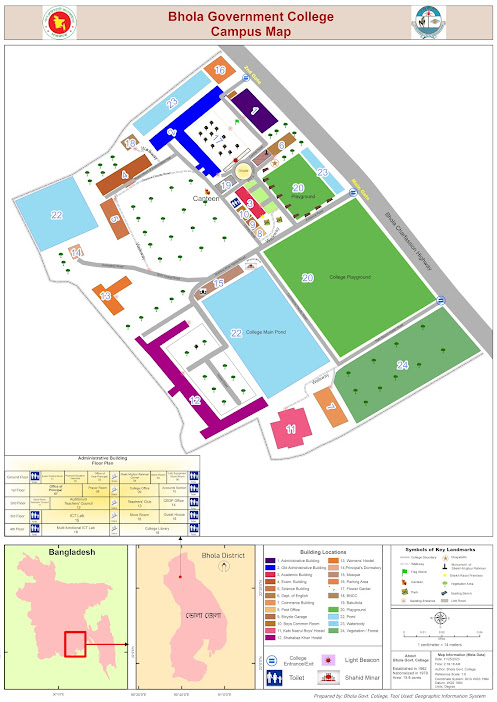
How to Prepare Campus Map or Any Institutional Location Map using ArcGIS and with a little help of Graphics
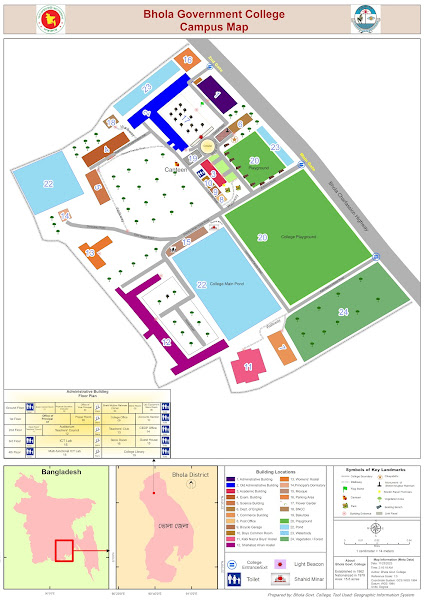
Locator map using ArcMap Creating a campus map or institutional location map using ArcGIS, coupled with graphic design elements, can significantly enhance the overall navigational experience for users. ArcGIS, a powerful geographic information system (GIS) software, allows for the integration of spatial data, making it an ideal tool for mapping diverse campus features. Begin the process by gathering relevant spatial data, such as building outlines, walkways, parking lots, and landmarks. This information can be collected through satellite imagery or surveyed using GPS devices. Import the data into ArcGIS, ensuring accurate georeferencing for precise spatial representation. Utilize the software's layering capabilities to organize the various elements of the campus map. Separate layers for buildings, roads, green spaces, and other features enable easy customization and updating. ArcGIS offers a range of symbology options, allowing users to choose distinct colors, symbols, and labels f...