Posts

Showing posts from November, 2019

Components of GIS

Image
Components of GIS A working Geographic Information System    seamlessly integrates five key components- 1. Hardware:- •            Computer •            Digitizer •            Scanner •            Printer/Plotter 2. Software:- GIS software provides the functions and tools needed to store, analyze, and display geographic information. The Key components of GIS Software are:- Tools for entering and manipulating geographic information such as addresses or political boundaries A database management system (DBMS)  Tools that create intelligent digital maps you can analyze, query for more information, or print for presentation  An easy-to-use graphical user interface (GUI) Major GIS software ARCGIS ( ArcView 10.1) ArcView: ESRI, the producer of ArcView, has been an industry leader in the production of GIS software and in the support of GIS education. Access ready-to-use ArcGIS for Desktop Basic (formerly known as ArcView), which allows one to view
history of GIS

Discuss briefly the history of GIS between 1960 to 2000 1963:   Computing comes of age (Establishment of the Urban and Regional Information System Association URISA and the first GIS Conference in Ottowa, Canada in 1963).    1964: Canada GIS-Roger Tomlinson “Father of GIS”    1964: Harvard Lab for Computer Graphics and Spatial Analysis    1970s GIS software evolves rapidly (more GIS companies appeared e.g. Intergraph, ESRI, Governmental departments introduced GIS e.g. The US Bureau of the Census)    1980s GIS software advances significantly (more budget and human resources allocated for GIS, by the end of 1980s more than 4000 GIS/CAD software are introduced)    Digital data becomes available (TIGER, World Data Bank, DIME)   1990s (integration of Raster and Vector based systems, Multi-media GIS, software become more user friendly)      2000:    Web-based GIS

Common Applications of GIS

Common Applications of GIS Crime mapping:- It is used on police crime maps. Collection of data regarding incidences and arrests on geographical areas which in turn helped increase police patrols to reduce crimes For Example :-   In the case where there is a kidnapping and the perpetrators (committers) of crime call to demand something then this technology can be used to locate the individual exactly where he or she is calling from. Media and Press: Journalists and editors use GIS in a number of ways: Creating valuable graphic images that help tell compelling stories.   Researching in depth information for articles.            Example:- Mapping the Medals In Olympic Census:- Integration of GIS technology in Census Mapping GIS introduced in Indian Census in 1992. Such software, as, ArcInfo, ArcView and ArcGIS have been extensively used. Real Estate:- Residential Real Estate:- A single map lets your customer compare multiple properties and their res

Top Benefits of GIS

Image
Top Benefits of GIS WHY IS GIS UNIQUE..? GIS handles SPATIAL information - information referenced by its location in space. GIS makes connections between activities based on spatial proximity.  GIS stores related geographic features in separate collections of files called map layers  Map layers can be reused easily and assembled into any number of map compositions and overlaid for analysis Top Benefits of GIS GIS benefits organizations of all sizes and in almost every industry. There is a growing awareness of the economic and strategic value of GIS. Better Decision Making: GIS is the go-to technology for making better decisions about location. Common examples include real estate site selection, route selection. Making correct decisions about location is critical to the success of an organization. Improved Communication: GIS-based maps and visualizations greatly assist in understanding situations and in storytelling. They are a type of language that imp

GIS Spatial Data Model

GIS Spatial Data Model Traditionally spatial data has been stored and presented in the form of a map. Three basic types of spatial data models have evolved for storing geographic data digitally. These are referred to as: ü       Vector Data Model ü       Raster Data Model                   Vector Data ü        Map features o         Points, lines, polygons o         Feature attributes ü        Every feature has attributes o         (e.g. name, area, population) Raster Data Stored electronic image or picture taken as an aerial photograph or satellite image. Composed of a rectangular array of square cells, called pixels, with a number in each cell representing the solid color fill of that cell. A new hybrid method of storing data is that of identifying point clouds, which combine three-dimensional points with RGB information at each point, returning a "3D color image". GIS thematic maps then are becoming more and more re

How Does GIS Works

Image
CREATING GIS  Essentially, geographic information states what is where. So to create geographic information, we have to record these two elements somehow. They can be captured through many different types of observations, measurements and surveys. Data can be sourced from aerial photography, satellite images, field samples, land surveying, population censuses, global positioning systems (GPS) and government administrative records among others. How To Combine Geographic Information..? If we are combining a number of different geographic information themes together, they may be from different sources, in different formats and covering different study areas.Therefore, we need to use a system to deal with the disparate sources and organize them so that they can be combined. A Geographic Information System does just that It is a tool for the input of different geographical information themes so that they can be stored, organized, displayed and analyzed. It uses geography

CREATING GIS

Image
CREATING GIS  Essentially, geographic information states what is where. So to create geographic information, we have to record these two elements somehow. They can be captured through many different types of observations, measurements and surveys. Data can be sourced from aerial photography, satellite images, field samples, land surveying, population censuses, global positioning systems (GPS) and government administrative records among others. How To Combine Geographic Information..? If we are combining a number of different geographic information themes together, they may be from different sources, in different formats and covering different study areas.Therefore, we need to use a system to deal with the disparate sources and organize them so that they can be combined. A Geographic Information System does just that It is a tool for the input of different geographical information themes so that they can be stored, organized, displayed and analyzed. It uses geography

Definition of GIS

What Is GIS Geographical Information System (GIS) is a computer based information system used to digitally represent and analyze the geographic features present on the Earth’s surface and the events that taking place on it. Geographic Information Systems provide a method for integrating and analyzing spatial (digital map based) information such as "where is the nearest Hospital?"  Alongside related non-spatial information (what services are given there?).  Many people are becoming far more familiar with seeing the results both textually - for example when their phone shows them the nearest Hotel - and on open map systems such as Google Maps.  GIS Capabilities/ Analysis with GIS Location: What is at a particular location...? Where is it….? Condition: identify a location where certain conditions exist..?  Trends: What has changed since...?  Patterns: What things are related..?  Modeling: What if…?  The Need for GIS: The real world has a

Installation Guide to install ArcGIS 10.6

Installation Guide to install ArcGIS 10.6 Install ArcGIS License Manager, when finished, License Server Administrator window will open automatically. Click on "Start/Stop License Service" tab and press "Stop".DO NOT CLOSE WINDOW (IMPORTANT!) Replace ARCGIS.exe and service.txt in folder "C:\Program Files (x86)\ArcGIS\License10.6\bin" with provided file Press "Start" and check at the bottom left corner of License Server Administrator window, it should show: "License Server Status: RUNNING" Install ArcGIS Desktop, when finished, ArcGIS Administrator window will open automatically Click on "Desktop" tab, select "Advanced (ArcInfo) Concurent Use" product and type "localhost" for License Manager Replace AfCore.dll in folder "C:\Program Files (x86)\ArcGIS\Desktop10.6\bin" with provided file. Optional, if x64 Background Geoprocessing is also installed, replace also the AfCore.dll in "C:

ArcGIS 10.6 Desktop full crack download

Go to the link and download from one drive. It also contains crack. Download Link:  Arc GIS 10.6  alternative Arc GIS 10.7  After downloading the software, follow the installation steps from the following link how to install arcgis 10.6

অধ্যায় ৪: বায়ুমণ্ডল ও বায়ু দূষণ ১

বায়ুমণ্ডল ও বায়ু দূষণ

অধ্যায় ৪: বায়ু দূষণ ও দূষক উৎস(একাদশ-দ্বাদশ শ্রেণী)

অধ্যায় ৪: বায়ু দূষণ ও দূষক উৎস

Earth's Two Motions: Rotation and Revolution

Image
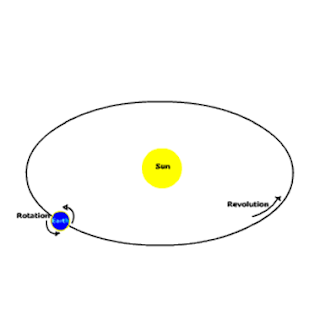
Earth's Two Motions: Rotation and Revolution  As a planet of the sun, the Earth revolves around the sun. Besides this, it also rotates on its own axis. Thus the Earth has two motions: the rotation and the revolution. Rotation The Earth rotates on its axis from west to east. The axis is an imaginary line passing through the northern and the southern poles. Earth's rotation is completed in about 24 hours — this is called the daily motion of the earth. This motion is responsible for the occurrence of day and night.  One rotation is completed when a given heavenly body crosses the observer's meridian two times in succession.  How rotation periods are calculated:  The period of rotation is calculated with reference to a star and with reference to the sun. When it is calculated with reference to a star, it is called a sidereal day and when it is calculated with reference to the sun, it is called a solar day.  Solar days and sidereal days:  The solar d

Origin of the Earth

Image
Origin of the Earth The universe is between 10 and 20 billion years old, and the common accepted age is 15 billion years. This is a very long time. To appreciate its depth, we'll map the history of the universe into one of our twelve-month calendar years. Our cosmic year begins with the formation of the universe at midnight. Although a lot goes on in the first few months, our galaxy, the Milky Way, doesn't form until May 1 and our solar system is absent until around September 9. Earth forms on September 14 and life originates in late September or early October. The Eukaryotes, the first cells with nuclei, are flourishing by mid-November but most of what we know about the history of life occurs in December. December opens with an increase in oxygen in our atmosphere, a by product of oxygen-producing algae that destroy themselves by overproducing oxygen. The first worms appear in mid-December, and plants begin colonizing the land around December 20. Life enters middle ag

Man Environment Relationship

Man Environment relationship Man Environment Relationship

Important Measures of Transport Networks

Image
Network analysis is an important aspect of transport geography because it involves the description of the disposition of nodes and their relationships and line or linkage of distribution . It gives measures of accessibility and connectivity and also allows comparisons to be made between regional networks within a country and between other countries. As Fitzgerald (1974) has said, variations in the characteristics of networks may be considered to reflect certain spatial aspects of the socio-economic system. The details of important measures of transport networks are given here for proper understanding and application of these measures for:   (i) The connectivity of networks; (ii) The centrality within networks; (iii) The spread and diameter of networks; and (iv) Detours. 1. Connectivity and its Measurement: “The connectivity of a network may be defined as the degree of completeness of the links between nodes” (Robinson and Bamford, 1978). When a network is abstracted