Posts

Showing posts from November, 2017

The Solstices and The Equinoxes

Image
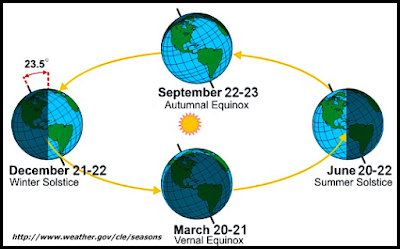
The Solstices The times when the Sun is at its furthest from the celestial equator are called the summer and winter solstices and these occur in mid-summer and mid-winter. The world 'solstice' comes from the Latin solstitium meaning 'Sun stands still' because the apparent movement of the Sun's path north or south stops before changing direction. Figure: Equinoxes and solstices Summer Solstice:  On 21st of June the sun's rays are vertical over the Tropic of Cancer as the north pole of the Earth is inclined at its maximum towards the sun. At this time, the North Pole experiences a long continuous day and the South Pole a long continuous night (ergo, what we know as summer solstice). The northern hemisphere has the summer season at this time and the southern hemisphere experiences winter now. Also the days are longer than the nights in the northern hemisphere at this time. Winter solstice :  On December 22, the position of the earth with

Temperature Belts of the World

Image
There are three different zones in earth arises due to the temperature difference these are called Heat zones of the earth. These are Torrid Zones, Temperate zones and Frigid Zones.  These heat zones are further divided into north Torrid Zone, south Torrid Zone, North Temperate Zone, South Temperate Zone, North Frigid Zone, and South Frigid Zone Heat Zones of the World Torrid zone-The Hottest Heat Zone It is the largest of the thermal zones and it covers almost half the area of the earth’s surface. The sun’s rays are almost vertical throughout the year in this zone.  The mid-day sun is overhead at equator on equinoxes, i.e. on 21 st March and 23rd September. It is also overhead at Tropic of Cancer on 21st June and at Tropic of Capricorn on 22nd December. The duration’s of day and night are always equal i.e. 12 hours each on the equator and they increase to 13 hours 27 minutes at tropics. Torrid Zone lies between Tropic cancer and Tropic of Capricorn. North torrid zon

Population – Environment interactions in Bangladesh

Image
Bangladesh is one of the most densely populated country in the world. Population growth rate is much higher than its carrying capacity. As population enlarges, there is smaller amount of per person natural resources such as water, arable land and forest. More people mean more exploitation of natural resources leading to degradation of environment. Figure: Inter linkage among man, environment and natural resource A very simple interaction between population and environment is that high growth of population may lead to over consumption of natural resources and degradation of ecosystem and environmental potentials but this relationship could be further aggravated by a number of other social factors which include the following: The economic systems based on high rates of resources consumption, environmentally damaging trade practices and lack of environmental accounting; Widespread poverty and unsustainable development efforts; Women’s inequity and the large unmet need

Atmospheric Pressure and Pressure Belts of the World

Image
Atmospheric Pressure Defined as weight of column of mercury 76 cm / 760 mm high at sea level Measured by Barometer Variation in Atmospheric Pressure Variation in atmospheric pressure is responsible for horizontal movement of winds Some of the factors affecting atmospheric pressure are “Temp. of air, Altitude, Water Vapor, Gravitational force & Rotation of earth                             Pressure belts of the world Due to the variation of temperature in different latitudes and the rotation of the earth, several pressure zones have been formed at the lower layer of the atmosphere which  are known as pressure belts. These pressure belts are: The Equatorial Low Pressure Belt The Sub tropic High Pressure Belts The Sub-polar Low Pressure Belts The Polar High Pressure Belts Equatorial Low Pressure Belt      This Equatorial Low Pressure Belt occupies an area lying on both sides of the equator extending from 0° to 5°. This region receives

Urbanization pattern: compare and contrast between MDCs and LDCs

Image
The world at this point in time is essentially urban. Approximately one half of the global population lives in cities, a figure that is as high as 75% if we look exclusively at the most developed nations.  But not all nations have experienced the same urbanization process, neither temporally nor with regard to the intrinsic characteristics of that process. With reference to the first point, the process of European urbanization took place fundamentally throughout the nineteenth century and was linked to the parallel phenomena of the industrialization and economic growth of the continent.  Table : Rural –Urban population in World, MDCs and LDCs On the other hand, less-developed nations are now immersed in an intense urbanization process, and their urbanization is not always accompanied by positive growth rates. With regards to the second point, there is a certain consensus about the existence of two contrasting patterns of urbanization: one is linked to countr

World rate of Urbanization and future projection

Image
The rate of growth of the world urban population is slowing down. Between 1950 and 2011, the world urban population grew at an average rate of 2.6 per cent per year and increased nearly five-fold over the period, passing from 0.75 billion to 3.6 billion. During 2011-2030, the world urban population is projected to grow at an average annual rate of 1.7 per cent, which, if maintained, would lead to a doubling of the urban population in 41 years. During 2030-2050, the urban growth rate is expected to decline further to 1.1 per cent per year, implying a doubling time of 63 years. Figure : World rate of Urbanization and future projection Source:   United Nations- World Urbanization Prospects: The 2011 Revision From the Map below it has been observed that during 1950-55, the urban growth rate was higher in those parts of the world which we call now MDCs. During 2000-2005 we have found the rate of urbanization became more or less stagnant in the developed countries even

World Urbanization Pattern: Level of Urbanization

Image
Urbanization patterns at the country level are much more varied than at the regional level. Furthermore, for most countries, the changes experienced over the second half of the twentieth century were remarkable. Thus, whereas in 1960 only a quarter of the all countries or areas in the world had more than 46 per cent of their population living in urban areas, by 2000 nearly half had 57 per cent or more of their population living in urban areas. If the country-level projections presented in this volume prove approximately correct, by 2030 over three-quarters of all countries or areas will have over half of their population in urban areas. Figure : World level of urbanization from 1960 to 2010 Data Source:  United Nations- World Urbanization Prospects: The 2011 Revision Level of urbanization that is the percentage of the total population living in urban areas, as defined by the country is not uniform throughout the world. It varies from countries to countries, region t