A Case Study of the Spatial Pattern of Road Transport in Ghaggar Plain
Following content has been collected from: http://www.geographynotes.com
The Ghaggar plain is a micro-geo-historic region of India
covering Ganganagar and Hanumangarh districts of the Rajasthan State, as
identified by R.L. Singh (1971) and C.D. Deshpande (1982). River Ghaggar is
known as a ‘dead river’ and at present it is simply in the form of dry bed,
flooded during rains. An important characteristic feature of this region is
that it was humid in very ancient period, became arid afterwards and with the availability
of canal water converted as an agricultural region, not only of the state but
of India. Among various means of transportation, road transport plays a vital
role in the transformation of the regional economy of the region.
Spatial
Pattern:
The simple distribution pattern of road transportation as
shown in Figure 4.12 indicates that although all the tehsils are well served by
roads, yet Suratgarh, Anupgarh, Nohar and Ganganagar tehsils are having 12.9,
11.2,11.1, and 10.1 per cent of the district road length respectively. In year
1981 the road length per 100 sq. kms was 10.27 kms and per 1,000 populations
was only 1.05 kms.

For intensive spatial analysis of road transportation in
a micro-region like Ghaggar plain, there is a need for network analysis.
Transport network, as described by Kansky (1963), is “a set of geographic
locations inter-connected in a system by a number of routes”. The present
analysis is based on three aspects, viz.,
(i) Connectivity,
(ii) Accessibility, and
(iii) Traffic-flow.
i.
Connectivity:
“The connectivity of a network may be defined as the
degree of completeness of the links between nodes” (Robinson and Bamfrod, 1978:
74). Connectivity can be measured by beta index (β) (B = arcs/nodes), alpha
index (r = a-n-1/2n – 5), gamma index (ү =arcs/3(nodes – 2)) and cyclomatic
number = a – (n -1). (Where α equals the number of arcs and n the number of
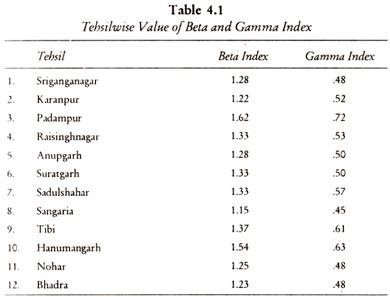
nodes.) We have selected, Beta and Gamma index for the analysis of spatial
pattern of connectivity. Table 4.1 indicates the tehsilwise value of these two
variables.

The value of beta index in the region varies from 1.22
for Karanpur tehsil to 1.62 for Padampur tehsil. In fact, there is very little
variation in beta index value, thus, indicates the uniform spatial pattern of
connectivity. The gamma index is a value that always lies between 0.000 and
1.00. The analysis of gamma index value also shows little variation 0.48 to
0.72 and as many as seven tehsils are having gamma index value between 0.48 and
0.53. Thus, we can conclude that connectivity in the region under study is more
or less uniform with little regional variations.
ii.
Accessibility:
‘One of the most important attributes of a transportation
network relates to accessibility, and the geographer is particularly concerned
with accessibility as a locational feature (Robinson and Bamford, 1978: 78).
Several methods have been used to measure and/or represent the accessibility.
The traditional one is the distance measured along routes or from centres.
Thus an area adjoining to a route or centres is more accessible and
inaccessibility increases with the distance from routes.
Within network,
accessibility can be measured in three ways:
(i) By shortest
path matrix,
(ii) By the associated number, and
(iii) By the Shimbel Index.
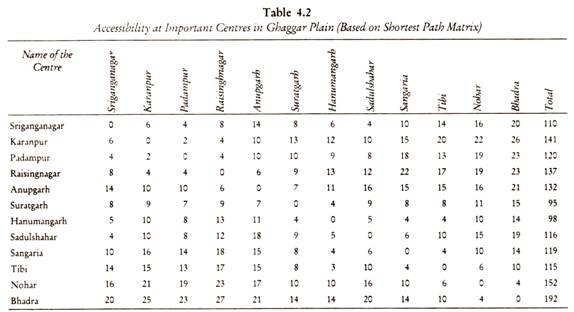
For the present study shortest-path matrix method had
been used. The method follows the number of arcs used in the shortest-path
between all possible pairs of nodes. Table 4.2 is the shortest-path matrix
between 12 important centres of the Ghaggar plain, thus indicates the
accessibility at these points. When the totals of each row are added up, the
lowest total indicates the node, which is most accessible, while the highest
number indicates the least accessible node. It becomes clear from the table
that Hanumangarh and Suratgarh are most accessible followed by Sriganganagar,
while Bhadra and Nohar are having lesser accessibility.

iii.
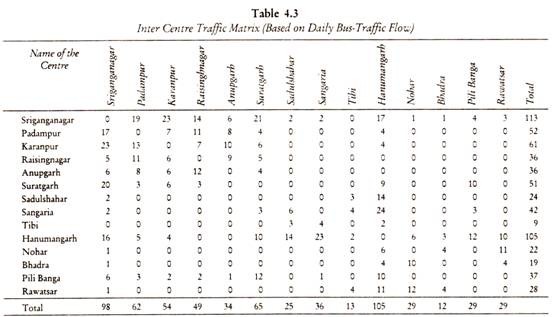
Traffic Flow:
Internal bus-traffic flow is an indicator of the movement
pattern of people. The present analysis is based on daily bus-traffic flow
between important centres of the region. The daily bus-traffic flow between 14
centres has been examined by arranging them in a matrix (Table 4.3). The total
score of each centres represents the degree of traffic flow. Thus,
Sriganganagar and Hanumangarh possess highest bus services, while Tibi, Bhadra
and Nohar are having lowest score in terms of daily bus-traffic flow.


Comments
Post a Comment